Research on Sand Dunes in the Sibley School
This work, which was sponsored by the Qatar National Research Foundation, brought together the Weill-Cornell Medicine Qatar, Richer Environments, the Biotechnology Centre of the Qatar Ministry of Environment, Maersk Oil in Qatar, the Ecole Polytechnique Federale de Lausanne, Tencate Geosynthetics, the Universite de Rennes, the Universite de Nantes, the Laboratoire 3SR of the Universite de Grenoble, DAMTP at the University of Cambridge, the LGPM laboratory of the Ecole Centrale de Paris, and the Faculte des Sciences de Nouakchott. We carried out measurements in the Sahara desert on barchan sand dunes in Mauritania, and in Qatar.
Our
motivation was to work against desertification by stabilizing sand dune
with microbiological means. The context of what we tried to
accomplish was aptly articulated by inspirational TED talks by Magnus Larsson and Allan Savory.
In general, our project looked at moisture and heat inside sand
dunes, toward understanding how microbes and higher animals survive in
hyper-arid sand environments. In particular, our collaborators Anthony
Hay of the Cornell Department of Microbiology
and Sara Abdul-Majid of Weill-Cornell Medicine in Qatar characterized microbes capable of metabolizing urea in Qatar sand
dunes through a process called 'Microbe-Induced Calcite Precipitation'
(MiCP), see for example de Jong et al and Hommel, et al . Our collaborators Renee Richer, Sara Abdul-Majid and Aurora Castilla documented the life of the skink 'Scincus Mitranus' in Qatar dunes. See also movies and articles by Dan Goldman and his team in their lab at Georgia Tech.
Visualize Michel Louge's presentation on the "Role of pore pressure gradients in geophysical flows over permeable substrates" at the Kavli Institute of Theoretical Physics in Santa Barbara during the conference on Fluid-Mediated Particle Transport in Geophysical Flows on Wednesday, December 18, 2013. The first part of the presentation concerns powders snow avalanches. The second discusses the role of the porous sand bed in desert ripples.
Latest news
We published in April 2022 an open-access article
in the Journal of Geophysical Research-Earth Surface on capacitance
probe measurements of ultra-low moisture levels just below the surface
of a barchan dune, see details below. The article was featured in a
number of news blogs, including this piece by David Nutt in the Cornell Chronicle, this one by Daniel Bardsley in the National based in Abu-Dhabi, this one by Al-Jazeera (in arabic), and this one in Science Alerts. Its data is archived at the Cornell eCommons.
A recently-published open access paper with Philippe Claudin and Bruno Andreotti reviews data on the evolution of pressure over harmonic surfaces.
In May 2017, we conducted a campaign of measurements on a Qatar dune. A summary is available by clicking on this link.
Click on the picture above to see photos and results of our January 2017 campaign in Qatar.
Click on the image above to see photos and details of our January 2016 campaign in Qatar.
Click on the picture above to see photos of our January 2015 campaign in Qatar.
Recent Articles
Louge, M. Y., Valance, A., Fang, J., Harnett, S. J., Porte‐Agel, F., & Chasle, P. (2024) Evolution
of turbulent boundary conditions on the surface of large barchan dunes:
Anomalies in aerodynamic roughness and shear velocity, aeolian
threshold, and the role of dune skewness.
Journal of Geophysical Research: Earth Surface, 129, e2023JF007599.
doi:10.1029/2023JF007599, open access. Data is archived at the Cornell
eCommons under doi:10.7298/6md9-1377.2.
Wind friction is the engine that erodes sand dunes, relentlessly pushing them over roads, houses and infrastructure. Our records of wind speed on crescent-shaped mobile dunes challenge the conventional understanding of this process. Comparing field measurements and models, we show that the highest friction occurs where the gentle upward dune surface abruptly gives way to a steeper avalanching downward slope. Our data also reveals that the `aerodynamic roughness', a measure of wind friction on sand, is at odds with historical data meant for turbulent pipe flow. Because numerical simulations are used to predict flow over landforms that are inaccessible to detailed measurements, we validate them against data on a large dune. Our observations imply that, to achieve greater fidelity, simulations should subdivide the fluid neighborhood of the dune more finely, and revisit how they treat aerodynamic friction on its surface. Although our work involved large desert dunes, we expect these suggestions to apply more broadly to atmospheric, fluvial or submarine landforms that are surrounded by rougher terrain or that feature sudden changes in slope.
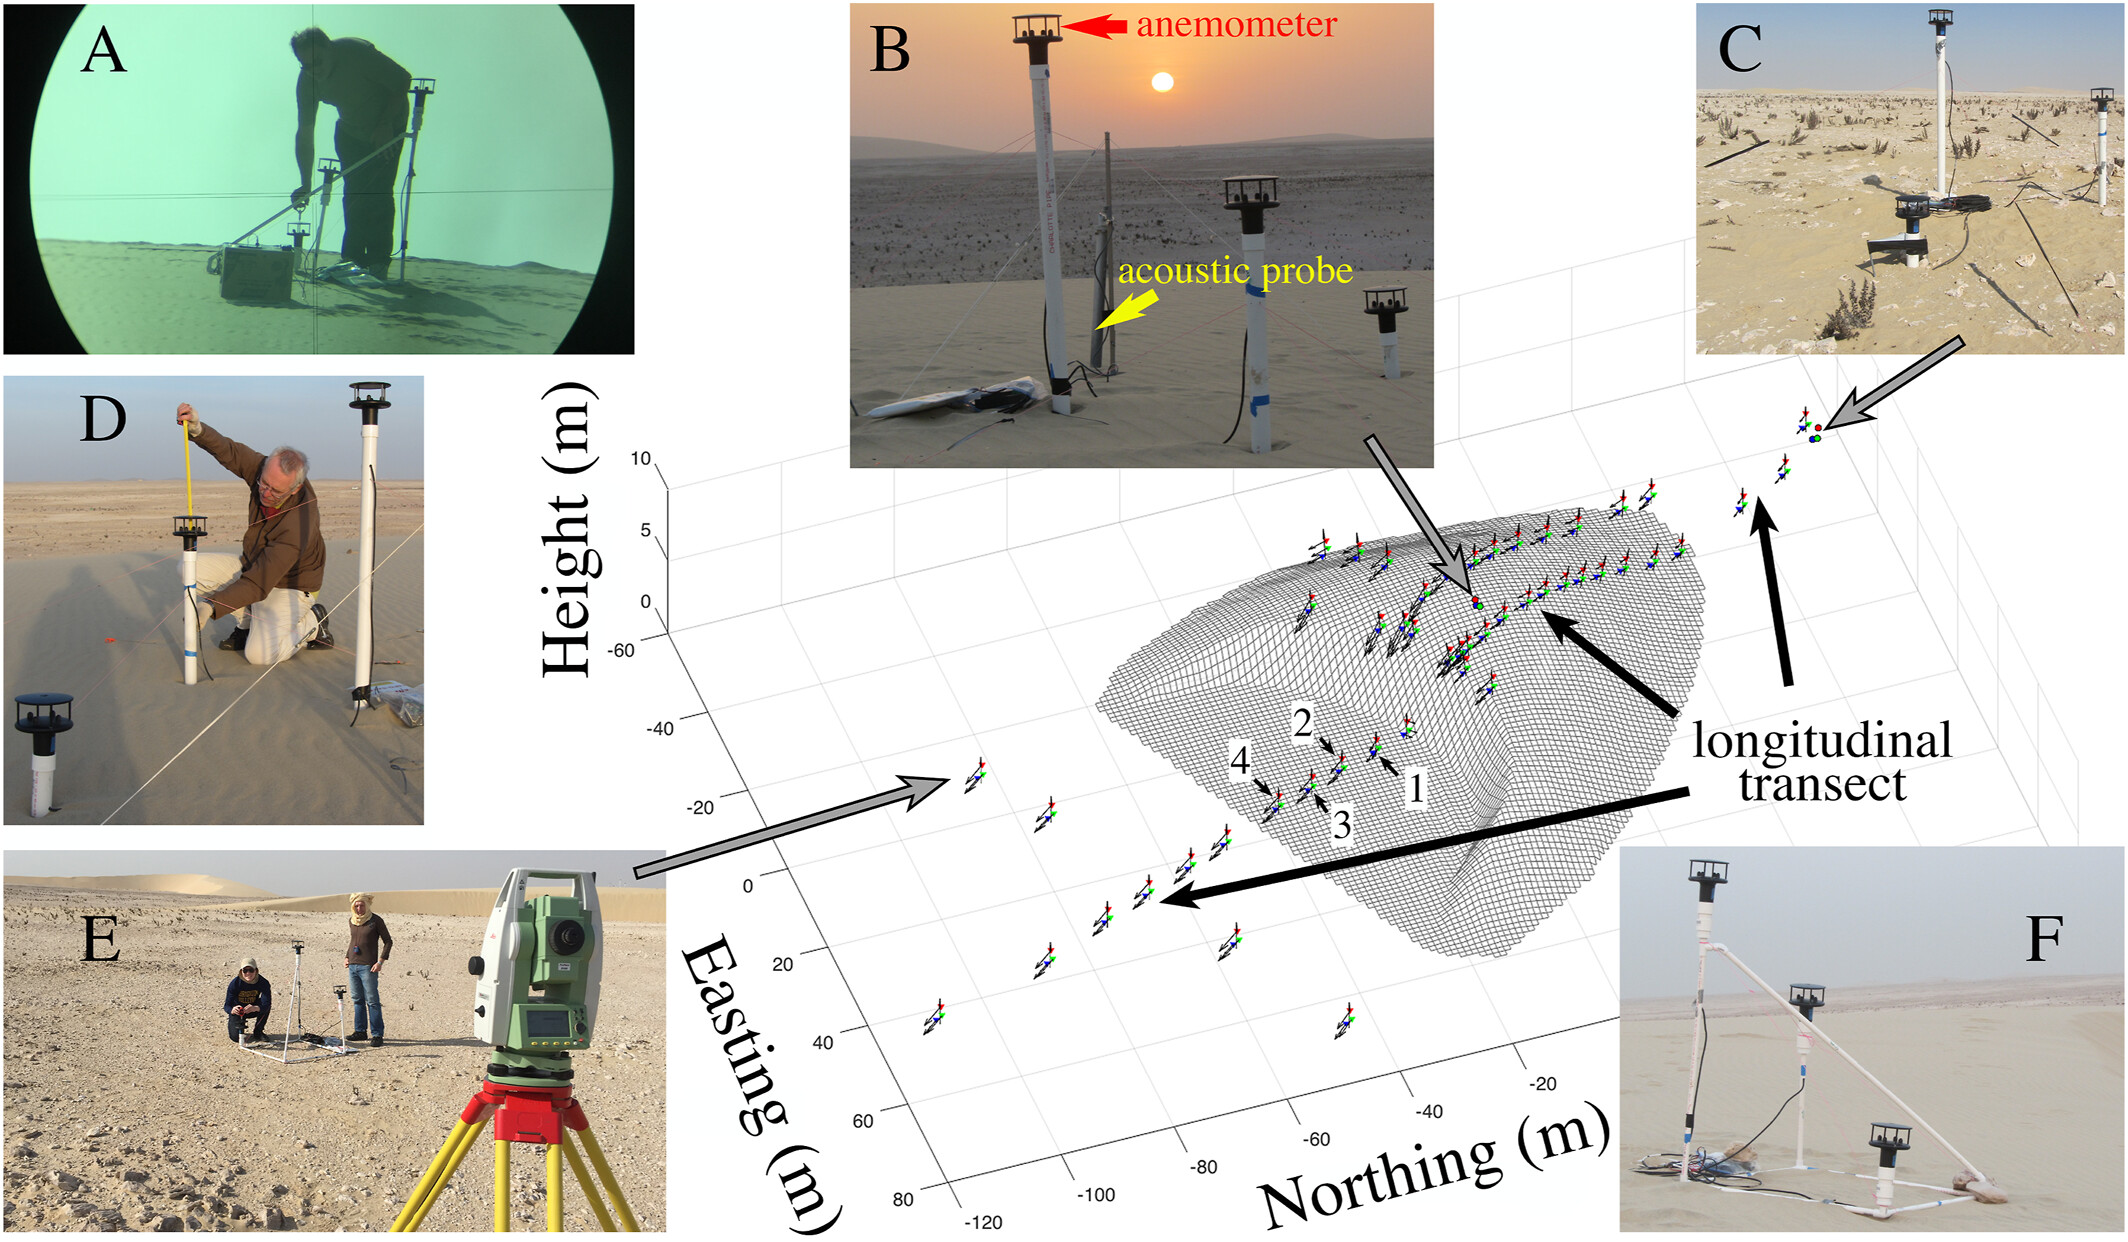
We recorded aerodynamic roughness and shear velocity along transects on and around mature crescent-shaped barchan dunes of 4.5m and 27m height above the horizontal rock-covered Qatar desert by fitting to the log-law time-averaged vertical velocity profiles acquired from triads of ultrasonic anemometers penetrating the inner turbulent boundary layer. Shear velocity first decreased, then recovered as air climbed on the dune, with a local maximum ahead of the crest as predicted by the Jackson and Hunt (1975) theory. Unlike flows over gentler bedforms without a slope discontinuity, an anomalous peak of shear velocity also arose on the dune centerline at the brink, which the theory attributed to skewness in the dune transect profile. The onset of aeolian transport produced a log-law passing through the Bagnold (1941) focal point. It was bracketed by noticeable hysteretic peaks in the correlation between wind speed and entrained sand flux. The dunes' rocky surroundings and topography produced an aerodynamic roughness at odds with the Nikuradse (1933) data for fully-developed turbulent boundary layers. Large-eddy numerical simulations illustrated the sensitivity of shear velocity to wide changes in aerodynamic roughness from desert floor to dune surface.
Louge, M. Y., Valance, A., Xu, J., Ould el-Moctar, A., & Chasle, P. (2022) Water
vapor transport across an arid sand surface - Non-linear thermal
coupling, wind-driven pore advection, subsurface waves, and exchange
with the atmospheric boundary layer.
Journal of Geophysical Research: Earth Surface, 127, e2021JF006490.
doi:10.1029/2021JF006490, open access. Data is archived at the Cornell
eCommons under doi:10.7298/kqgg-5888.
Deserts inhale and exhale water vapor through their surface. Although this process affects the water balance over vast sand seas, it is poorly understood for want of sensitive instruments. We discover how it operates using a new probe that detects tiny amounts of moisture on sand grains.
Our analysis reveals that vapor infiltration is considerably slower in dry sand, and that wind flowing over a dune creates weak internal air currents contributing to the transport of moisture. Their strength depends on dune location, wind speed and direction.
When wind is strong enough to let dry sand meander over a dune, the resulting rapid variation in surface moisture sends evanescent waves of humidity downward. An analysis of these waves implies that water evaporation from individual sand grains behaves like a slow chemical reaction.
The exchange of moisture with the atmosphere is not always driven by the difference between humidity at the dune surface and in the ambient, as current models assume, and it is weaker than they predict.
In future, the new probe can be used as "ground truth" to calibrate satellite observations over deserts, explore extra-terrestrial environments holding scant water, and detect moisture contamination in pharmaceutical products.
Dunes inhale and exhale moist air. (A) seepage velocity divided by the characteristic time for permeability vs diurnal time (midnight = 0, 1, 2, etc). (B) Wind bearing vs diurnal time. (C) Dune altitude transect along the wind (dotted line) and dimensionless pressure excursion on its surface. (D) Power spectrum of Fourier pressure excursion modes for various wind bearings. (E) Dune inhalation and exhalation pattern at a specific time. A movie animating this pattern is available by clicking on the figure above, or at this link. (F) Color scale for (E). Detailed caption, see Fig. 8 of the main article.
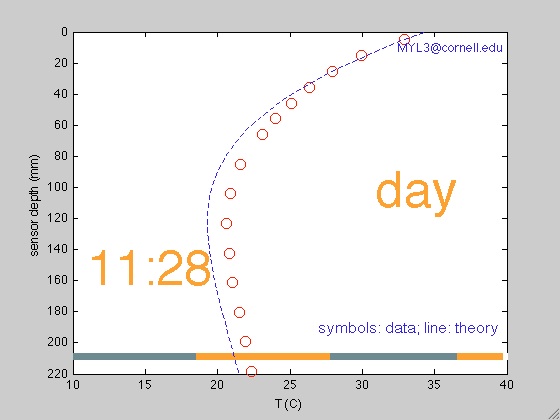
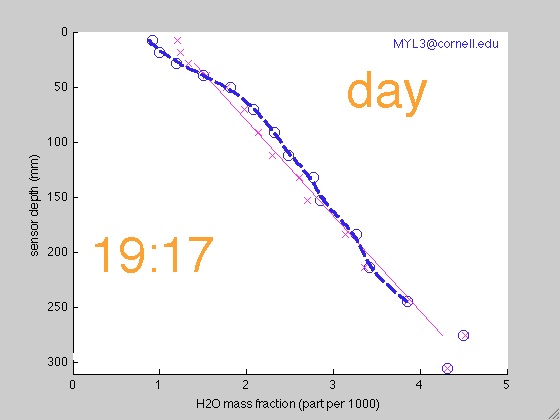
Predictions of the model for penetration of moisture in the dune at two times. Grey symbols are measurements with the capacitance probe. Blue lines are predictions. Red lines are temperature profiles. A movie animating this pattern is available by clicking on the figure above, or at this link. Detailed caption, see Fig. 4 of the main article.
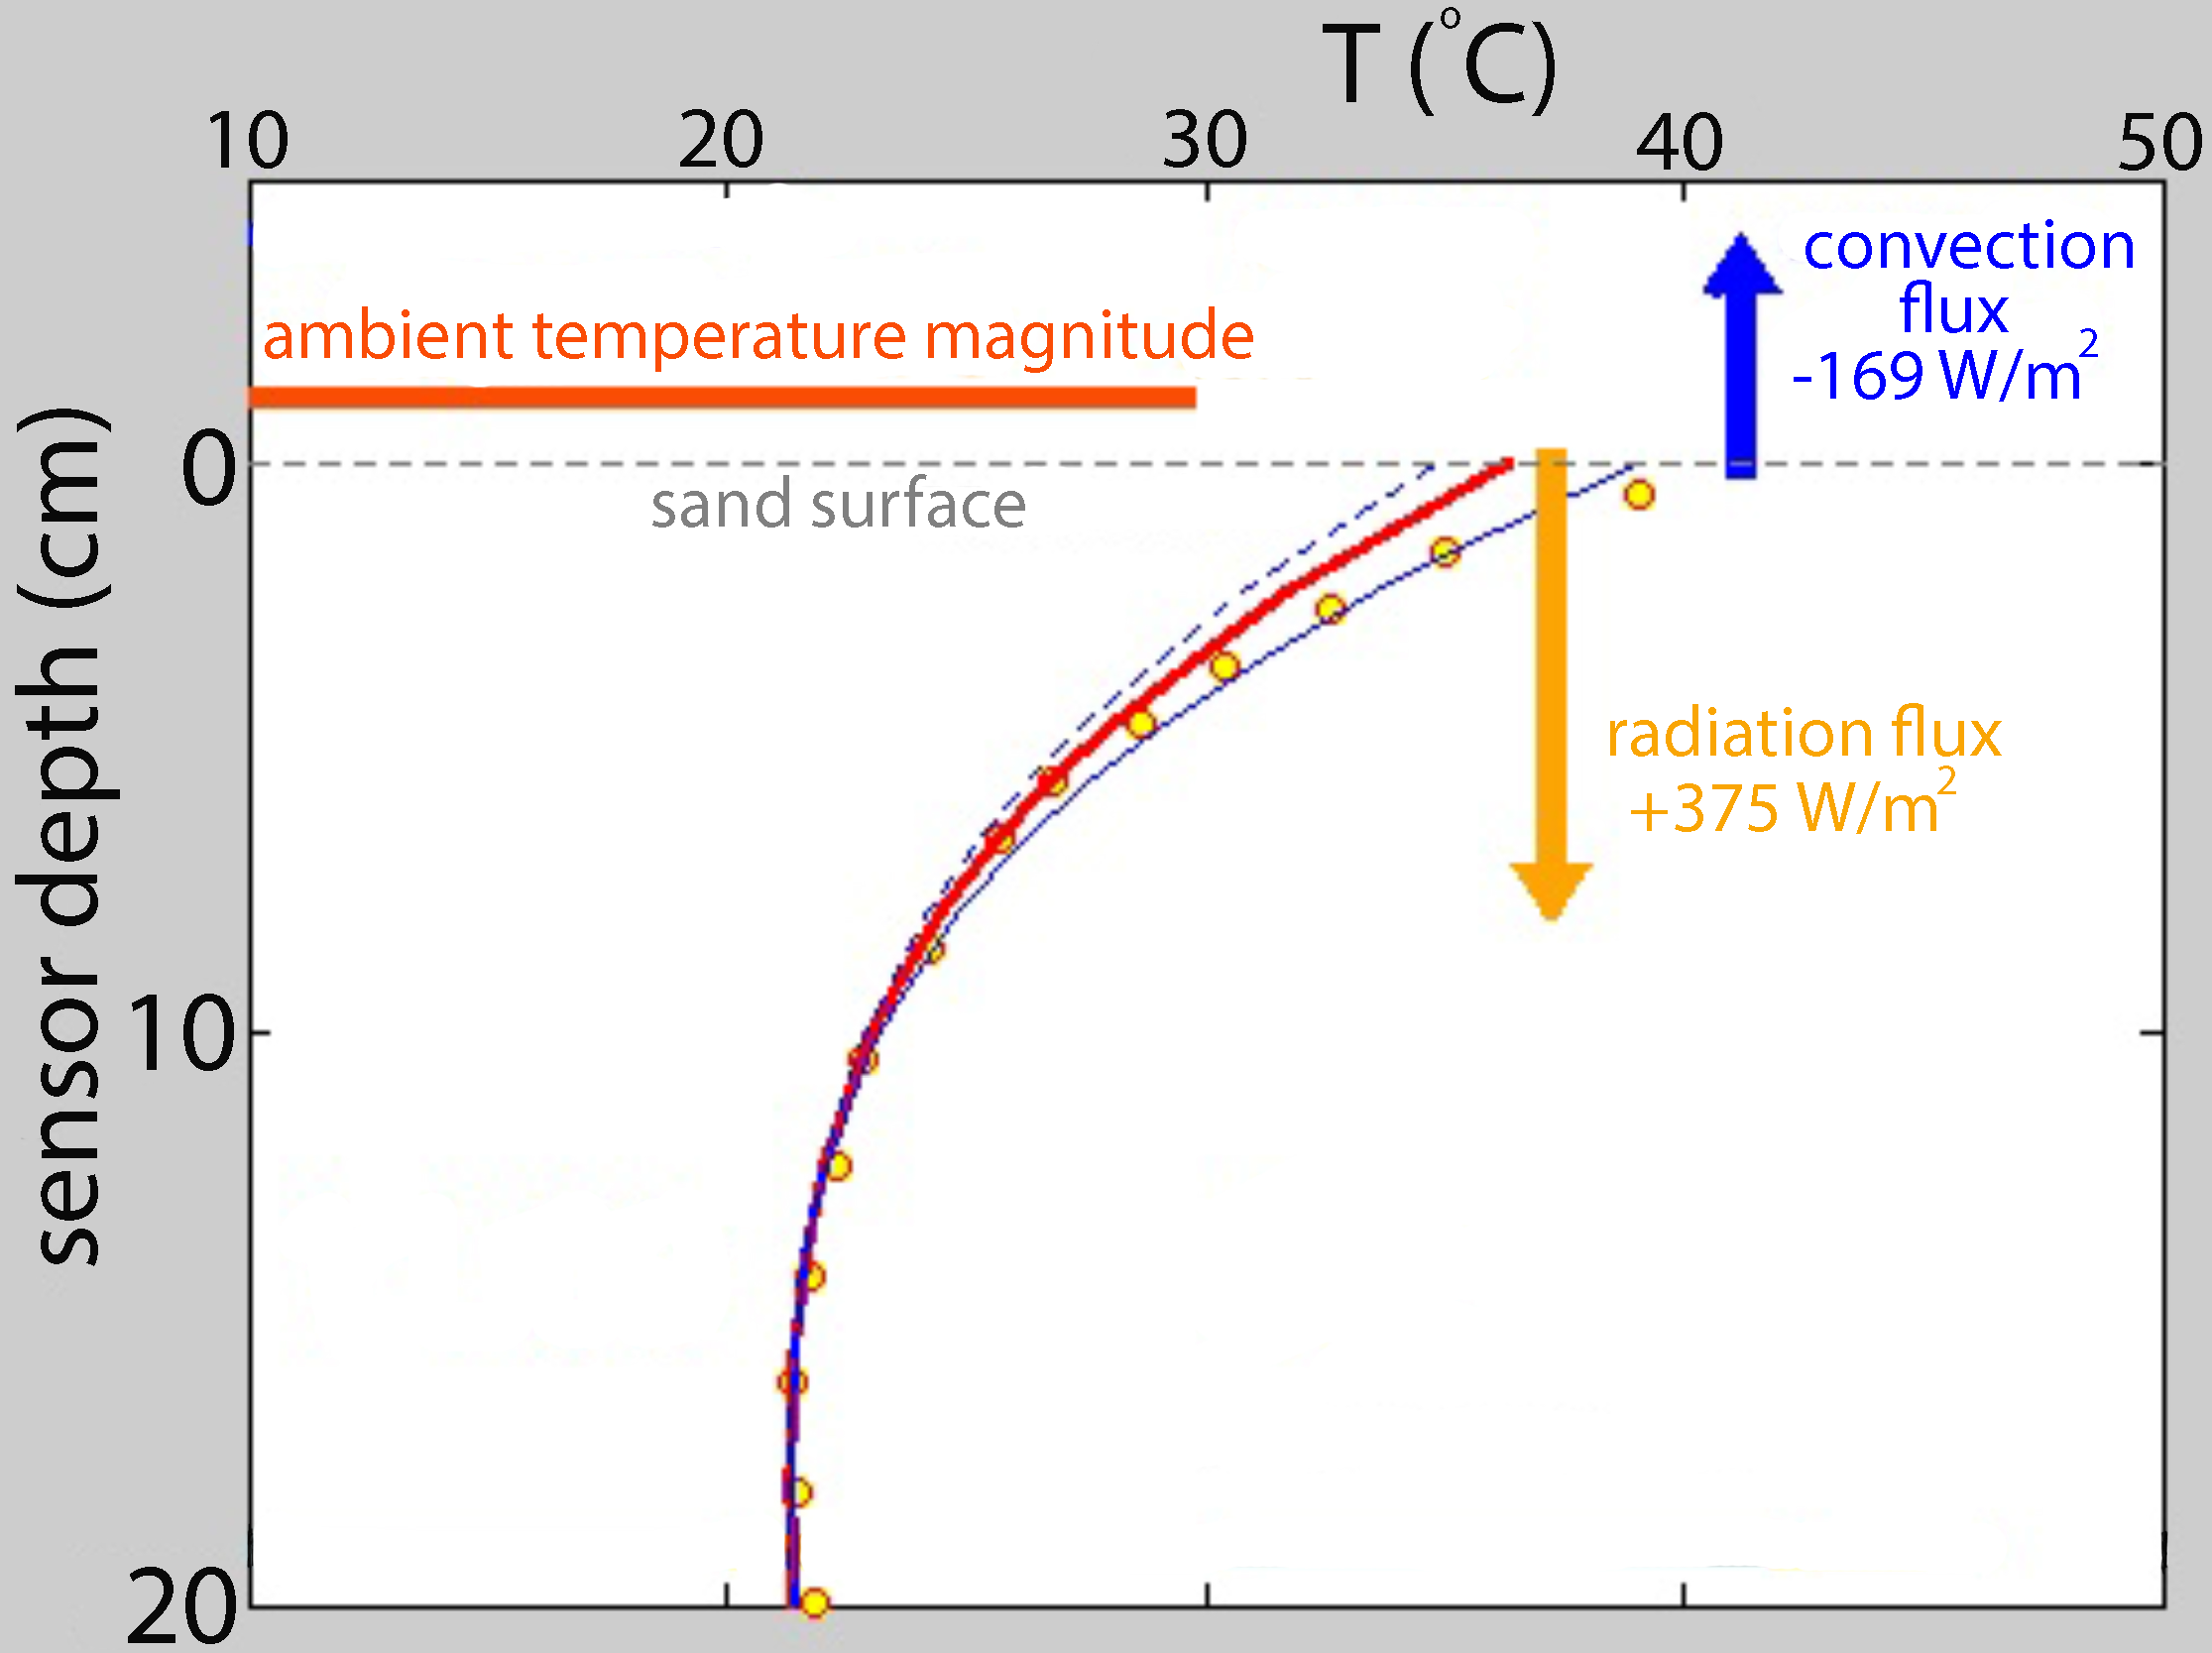
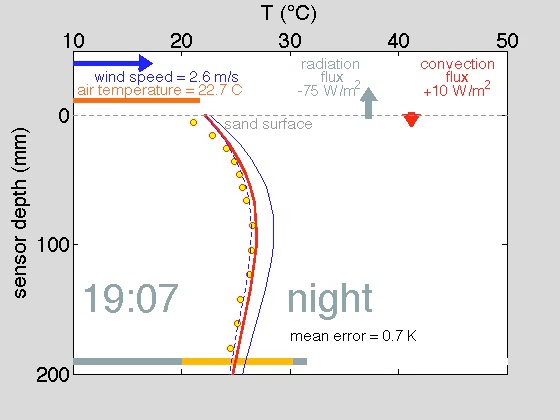
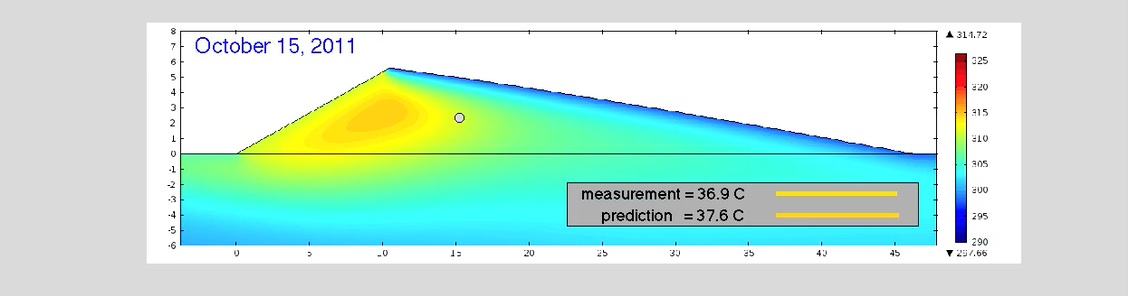
Measurements of temperature (yellow symbols) and predictions of the model (red line) just below the sand surface. A movie animating this pattern is available by clicking on the figure above, or at this link. Detailed caption, see Fig. 5 of our article "Temperature and humidity within a mobile barchan sand dune, implications for microbial survival".
Philippe Claudin, Michel Louge and Bruno Andreotti (2021) Basal Pressure Variations Induced by a Turbulent Flow Over a Wavy Surface. Front. Phys. 9, 275. doi:10.3389/fphy.2021.682564, open access.
Turbulent flows over wavy surfaces give rise to the formation of ripples, dunes and other natural bedforms. To predict how much sediment these flows transport, research has focused mainly on basal shear stress, which peaks upstream of the highest topography, and has largely ignored the corresponding pressure variations. In this article, we reanalyze old literature data, as well as more recent wind tunnel results, to shed a new light on pressure induced by a turbulent flow on a sinusoidal surface. While the Bernoulli effect increases the velocity above crests and reduces it in troughs, pressure exhibits variations that lag behind the topography. We extract the in-phase and in-quadrature components from streamwise pressure profiles and compare them to hydrodynamic predictions calibrated on shear stress data.
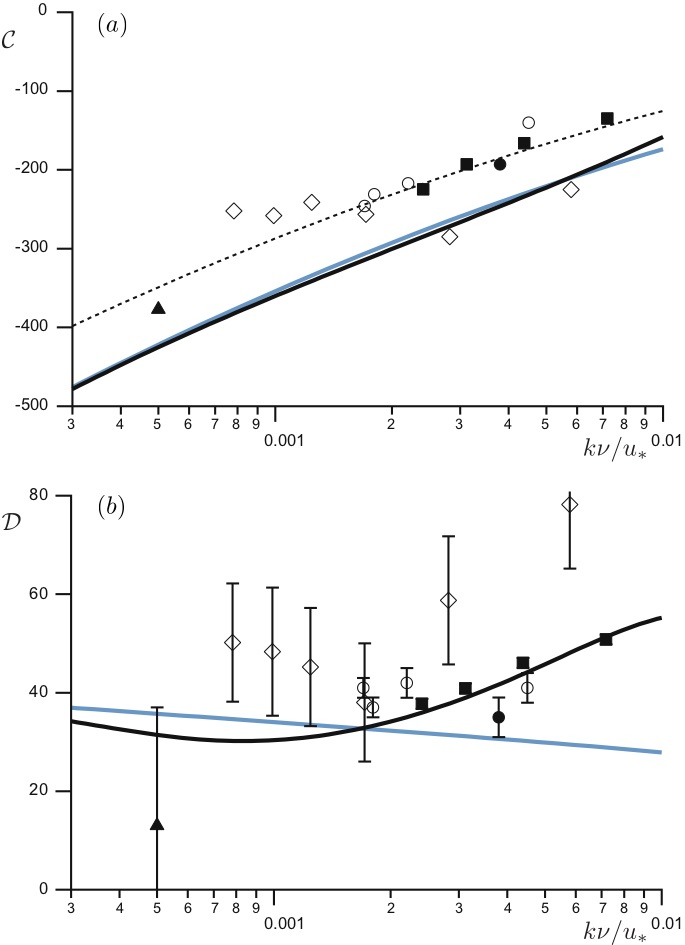
Pressure coefficients C and D.
Sara Abdul Majid, Michael F. Graw,
Aspasia Chatziefthymiou, Hanh Nguyen, Renee Richer, Michel Louge, Ali
A. Sultan, Patrick Schloss, Anthony G. Hay (2016) Microbial Characterization of Qatari Barchan Sand Dunes. PLoS ONE 11(9): e0161836. doi:10.1371/journal.pone.0161836, open access.
This study represents the first characterization of sand microbiota in migrating barchan sand dunes. Bacterial communities were studied through direct counts and cultivation, as well as 16S rRNA gene and metagenomic sequence analysis to gain an understanding of microbial abundance, diversity, and potential metabolic capabilities. Direct on-grain cell counts gave an average of 5.3 ± 0.4 x 10^5 cells g-1 of sand. Cultured isolates (N = 64) selected for 16S rRNA gene sequencing belonged to the phyla Actinobacteria (58%), Firmicutes (27%) and Proteobacteria (15%). Deep-sequencing of 16S rRNA gene amplicons from 18 dunes demonstrated a high relative abundance of Proteobacteria, particularly enteric bacteria, and a dune-specific-pattern of bacterial community composition that correlated with dune size. Shotgun metagenome sequences of two representative dunes were analyzed and found to have similar relative bacterial abundance, though the relative abundances of eukaryotic, viral and enterobacterial sequences were greater in sand from the dune closer to a camel-pen. Functional analysis revealed patterns similar to those observed in desert soils; however, the increased relative abundance of genes encoding sporulation and dormancy are consistent with the dune microbiome being well-adapted to the exceptionally hyper-arid Qatari desert.
Louge, M. Y., A. Valance, A. Ould el-Moctar, J. Xu, A. G. Hay, and R. Richer (2013), Temperature and humidity within a mobile barchan sand dune, implications for microbial survival, J. Geophys. Res. 118, doi:10.1002/2013JF002839, open access.
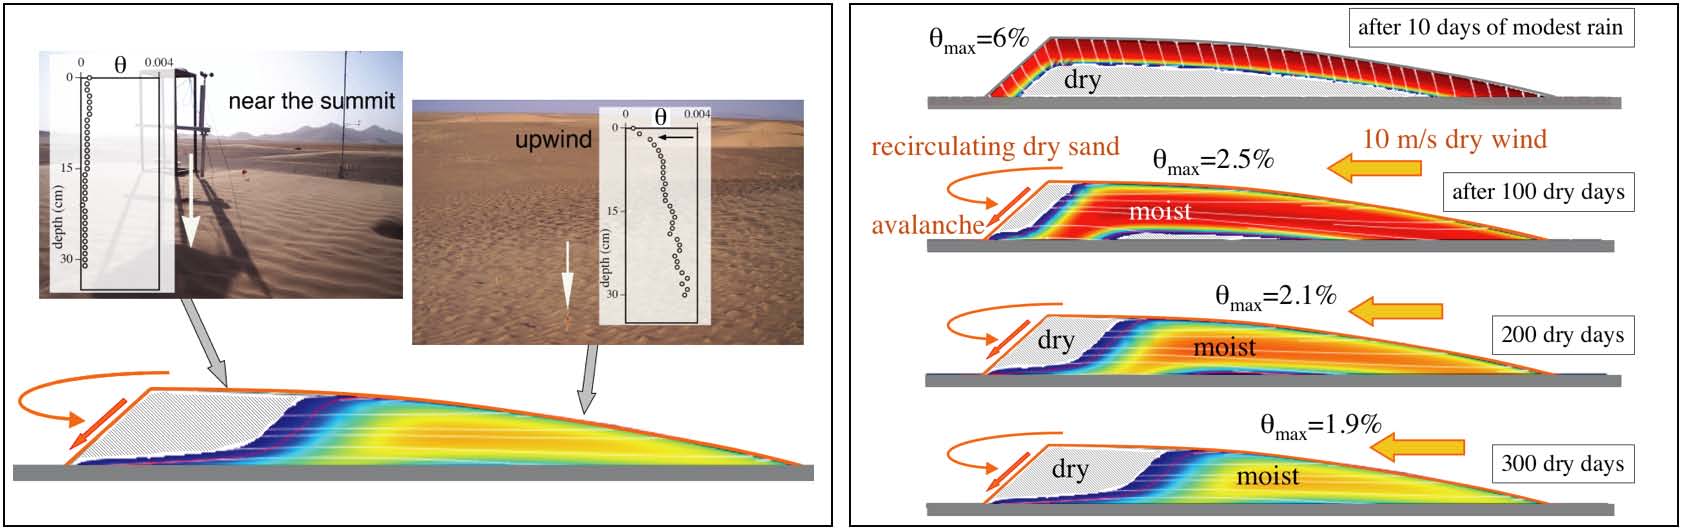
Although microorganisms play an important role in biological soil crusts and plant rhizospheres in deserts, it is unclear whether temperature and moisture deep within relatively fast-moving hyper-arid mobile dunes present a suitable habitat for microbes. To inform this question, we report measurements of temperature and humidity from probes initially sunk below the leeward avalanche face of a mobile barchan dune in the Qatar desert, emerging windward after 15 months of deep burial. Despite large diurnal variations on the surface, temperature within this dune of 5.6m height is predictable (see movie), as long as dune advection is properly considered. It evolves on smaller amplitude and longer time scale than the surface, lagging average seasonal atmospheric conditions by about two months. We contrast these deep thermal records with measurements of diurnal variations of the temperature profile just below the surface (see movie), which we calculate with a thermal model predicting the relative roles of wind-driven convective heat transfer and net radiation flux on the dune. Observations and analyses also suggest why random precipitation on the leeward face produces a more unpredictable moisture patchwork on the windward slope. By rapidly reaching sheltered depths, small quantities of rain falling on that face escape evaporation and endure within the dune until resurfacing upwind. At depths below 10cm, we show that moisture, rather than temperature, determines the viability of microbes, and we provide initial microscopic and respiration-based evidence of their presence below the windward slope.
Microbial life on a Qatar dune sand grain. Left: Fluorescence micrograph of a single sand grain showing an abundance of bacteria. Live cells stained green with Syto 9 using a technique similar to Gommeaux, et al (2010). Cells stained red/orange with propidium iodide are dead or dormant (400x magnification using a Zeiss Axio LSM 710 Fluorescence Microscope). Right: image of a similar sand grain from an FEI Quanta 200 Environmental Scanning Electron Microscope (ESEM) in low vacuum mode.
Download our slides for the ICACM-2013 conference in Aussois, May 2013. This presentation draws attention to the role of pressure gradients in counteracting gravity in porous media such as snowpacks and desert sand ripples. Further information on this subject is provided in the following paper:
Musa, R. A., S. Takarrouht, M. Y. Louge, J. Xu, and M. E. Berberich (2014), Pore pressure in a wind-swept rippled bed below the suspension threshold, J. Geophys. Res. Earth Surf., 119, doi:10.1002/2014JF003293., open access.
Toward elucidating how a wavy porous sand bed perturbs a turbulent flow above its surface, we record pressure within a permeable material resembling the region just below desert ripples, contrasting these delicate measurements with earlier studies on similar impermeable surfaces. We run separate tests in a wind tunnel on two sinusoidal porous ripples with aspect ratio of half crest-to-trough amplitude to wavelength of 3% and 6%. For the smaller ratio, pore pressure is a function of streamwise distance with a single delayed harmonic decaying exponentially with depth and proportional to wind speed squared. The resulting pressure on the porous surface is nearly identical to that on a similar impermeable wave. Pore pressure variations at the larger aspect ratio are greater and more complicated. Consistent with the regime map of Kuzan et al. (1989), the flow separates, creating a depression at crests. Unlike flows on impermeable waves, the porous rippled bed diffuses the depression upstream, reduces surface pressure gradients, and gives rise to a slip velocity, thus affecting the turbulent boundary layer. Pressure gradients within the porous material also generate body forces rising with wind speed squared and ripple aspect ratio, partially counteracting gravity around crests, thereby facilitating the onset of erosion, particularly on ripples of high aspect ratio armored with large surface grains. By establishing how pore pressure gradients scale with ripple aspect ratio and wind speed, our measurements quantify the internal seepage flow that draws dust and humidity beneath the porous surface.
Text files contain data collected on turbulence velocity profiles and pore pressure. This ReadMe file explains how to use these text files.
Note the typo in Fig. 7 of this article: the caption should read h0/lambda = 3%.
Flow development on the artificial rippled bed in the wind tunnel.
The graph above shows the sharp contrast between dimensionless static pressures at the surface of impermeable ripples (symbols) and the same pressure on our porous solid (lines) at 6% ripple aspect ratio. By diffusing the depression created by flow separation behind the crest (halfway on the horizontal axis), the porous medium reduces pressure on the first half of the ripple.
The above image shows the dimensionless pore pressure gradient that we measured in our rippled bed at 3% aspect ratio. Note the contrast with the same field at 6% ratio, shown below. Where the gradient field is largest (shown in red), ripples of large aspect ratio have a greater propensity to relieve bed weight and thus enhance surface erosion. In the paper above, we derive a geometrical criterion indicating when ripple mobilization by internal pressure gradients prevails over aeolian erosion of surface grains. We expect that such mobilzation, which has often been ignored in Shields-like erosion threshold criteria, is important in the formation of megaripples.
For this work, Ryan Musa, Brian Mittereder, and Mike Berberich designed and built a unique setup to record pore pressure within a porous rippled plastic sheet reproducing seepage flow within desert ripples. They used CNC milling machines to create waves on the free surface. Once they demonstrated feasibility of these measurements in Cornell's Environmental Wind Tunnel, Smahane Takarrouht took an extensive data set for mean and fluctuation pore pressure by multiplexing pressure taps to a single MKS Baratron 10 mTorr differential pressure transducer with a Scanivalve in the summer 2011. In the Fall 2011, Amin Younes constructed another bed with twice the ripple amplitude.
Left: Brian Mittereder with the Okuma CNC milling machine. Right: the porous rippled bed being machined.
Left: the design team and their realization. Right: Smahane
Takarrouht takes measurements in the wind tunnel on the rippled bed of
3% aspect ratio.
Amin Younes with the rippled bed of 6 mm amplitude,
which he manufactured on the Architecture department CNC with the help of Frank Parish.
Field expedition blog
Our latest field campaign took place in May 2017 in Qatar. Data from earlier field campaigns (March 2010 and January 2011 in Mauritania; March 2011, June 2011, November 2011, January 2012, April 2012, July 2012, November 2012, April 2013, January and April 2014, January 2015, 2016, 2017 and May 2017 in Qatar) are found below.
In May 2017, we carried out anemometry measurements on a large dune of 28m height in a similar way than in January 2016 and January 2017. We also captured infrared movies and pictures, and studied the diffusion of moisture in the dune stratigraphy using a unique capacitance probe first deployed in January 2016.
Clockwise from top left: (1) Alexandre Valance downloads data from the "roving" anemometer triad laid on the dune brink. (2) Alexandre and Patrick Chasle set the orientation of the triad. (3) Alexandre downloads data from the data logger of the anemometer triad fixed near the dune top. (4) An infrared picture of the dune. (5) Patrick and Alexandre carry the roving triad to a new location. (6) The roving triad on the rough desert floor around the dune. (7) View from the Leica Total Station that Michel Louge used to record the position of all anemometers.
The Fluke TI-450 60Hz infrared camera installed on a tripod in front of the dune shown in the inset. Left: one of the resulting images taken around noon Qatar time. Right: Alexandre Valance and Patrick Chasle descend on the avalanche face. Bottom right: Precautions are taken to avoid overheating the camera in the searing desert heat.
Patrick Chasle (left) and Alexandre Valance (right) deploy the capacitance probe that Carlos Mejia (lower right) designed for measuring moisture diffusion across the dune stratigraphy (inset). The Kipp and Zonen NR Lite 2 radiometer is also positioned on the dune (background).
In January 2017, we repeated the January 2016 anemometry measurements on the usual barchan dune. Microbiologists Anthony Hay and Amir Elsamadisi carried out biogeotextile sand aggregation tests. Nathalie Vriend and Matthew Arran of the University of Cambridge sampled sands at various depths and locations on several barchans in the same dune field.
Results of this campaign are summarized in an abstract presented at ICAR 2018 in Bordeaux. The entire book of abstract is available on this site. M. Y. Louge, A. Valance, J. Fang, S. Harnett, and F. Porte-Agel, Anomalous shear velocity at the brink of a barchan dune, ICAR-2018.
Clockwise from top left: (1) Patrick Chasle sets the Leica prism on top of one of the three roving anemometers to fix its position on the dune. (2) Michel Louge measures elevation of one of the three anemometers fixed at the dune crest. (3) John Bartlett holds the Leica prism to fix the position of one of the corners of the box laid by Alexandre Valance on the dune to record ripple wavelength and amplitude. (4) The roving anemometer triad behind the West horn of the barchan. (5) Michel Louge uses the Leica Total Station to fix positions in and around the dune. (6) The fixed crest anemometer triad at sunset.
Clockwise from middle left: (1 and 2) Amir Elsamadisi extrudes a column of sand sampled from the dune. (3) In the lab, Anthony Hay and Amir prepare bottles designed to deliver known amounts of colored water to sand. (4 and 5) Anthony on the study plot. (6) Selfie on the WCM-Q courtyard with Amir, Alexandre, Anthony and Michel.
Anemometry results of the January 2017
campaign superimposed on the dune outline. Blue, green and red
triangles are individual roving anemometers at three elevations.
Circles are fixed triads upstream of the dune and at its crest. Arrows
represent recorded velocity vectors. All anemometers were Windsonic Ultrasonic wind and direction sensors with zero speed threshold, acquired with CR800 data logger from Campbell Scientific.
In January 2016, we measured wind patterns on the barchan dune shown below. We used Windsonic anemometers arranged in groups of three at elevations of 30cm, 70cm and 110 cm above the surface. Data was acquired by Campbell CR800 data loggers.
Two groups were deployed at fixed positions, respectively located
windward of the dune and at the crest (shown as blue triangles in the
dune survey below). Then we moved a roving anemometer designed by Steve
Harnett to various points on the dune surface for measurements on the
order of 20 minutes. Fortunately, we had reasonably stable winds mostly
blowing along the 160 deg bearing of the dune. We also deployed
microphones encased in metal cylinders to record local transported sand
flux.
Dune surveyed in January 2016 with color representing local slope.
Height is exaggerated by a factor of three. Each black dot is the
position of a Windsonic anemometer part of a group of three mounted on
a roving frame. Blue triangles mark fixed Windsonic anemometers
windward and at the crest.
Clockwise from top left: Michel Louge operates the Leica total station
surveying the dune. Roving anemometers on the dune and at the brink.
Patrick Chasle, Carlos Mejia and Alexandre Valance carry the roving
station assembly to a new location. Alexandre and Carlos behind the
dune. Michel and Patrick at sunset. Alexandre and Carlos in the reticle
of the Leica poised to record roving anemometer positions. Background:
an aerial picture of the dunes courtesy of Sylvain Michel. The smaller
dune on the upper left is the one on which we conducted the anemometry.
Clockwise from top left: Carlos Mejia, Alexandre Valance and Patrick
Chasle deploy a new ultra-sensitive capacitance instrument to record
very low humidity on a 2D plane below the surface of the avalanche
face. Carlos holds with the left hand his design of the 2D capacitance
probe and with the right hand the temperature probe also deployed in earlier campaigns.
Patrick tunes his automated data processing and acquisition system of
capacitance, temperature and radiation probes conditioned in a small
suitcase. Alexandre inserts the temperature probe into the avalanche
face. Background: the avalanche face, the Kipp & Zonen radiometer,
the data acquisition suitcase beneath a radiation blanket, as well as
batteries and the solar panel to charge them for long-term measurements.
Clockwise from bottom right: Anthony Hay and Amir Elsamadisi prepare
rings for these experiments. Helped by Sara Abdul-Majid, they hammer
those into the dune. They inoculate them with indigenous microbes under
cover of a tent. The lower left corner shows field samples covered with
different geotextiles. Background: an aerial picture of the dunes
courtesy of Sylvain Michel. The large dune in the foreground is the one
on which biogeotextiles were tested in this campaign.
In January 2015, we deployed on a large dune a ground-penetrating radar (GPR) loaned to our collaborator Nathalie Vriend of the Department of Applied Mathematics and Theoretical Physics at the University of Cambridge by Alan Hobbs at the Geophysical Equipment Facility of the UK's National Environment Research Council. Participants in this campaign included Nathalie Vriend, Matthew Arran, Anil Netravali, Anthony Hay, Thomas McKay, Anushree Acharya, Sullen Qassim, Ali Sultan, and Michel and Nadine Louge.
Composite picture of our January 2015 campaign of measurements on a large dune at 25° 00.630'N 51° 20.026'E. From left to right and top to bottom: Matthew Arran fixes a sand sample with epoxy resin to study its fine stratigraphy. Anthony Hay poses near sunset. Michel and Nadine Louge watch Anil Netravali slide down the avalanche face of the dune, making it "sing" in the process. Tom McKay of the Maersk Oil Research and Technology Centre adjusts his head gear before resuming GPR measurements. Sullen Qassim sets the GPR antenna on the dune surface. Matthew Arran and Nathalie Vriend stand beside a pit dug to inspect dune stratigraphy. Nadine Louge stands at the base of the 55m-long avalanche face after recording positions along a rope marking GPR measurement locations. Michel Louge poses infront of that face. Nadine Louge is seen through the reticle of the Leica TS02 total station holding its reflecting prism. The colored 3D graph shows a reconstruction of the dune shape from about 800 point measurements.
Nadine poses behind her namesake, which she helped to survey on January 15, 2015.
Nathalie Vriend (left) and Sullen Qassim operate the GPR.
Relative size and position of the two dunes surveyed in January 2015.
April 2014 in Qatar
In April 2014, we deployed a ground-penetrating radar menioned earlier on the smaller sand dune at 25° 00.597'N 51° 20.409'E.
April 2013 in Qatar
In April 2013, we deployed a GeoDetect® system of fiber Bragg gratings
to measure strain and temperature on the avalanche face of a barchan
sand dune in Qatar. The system consisted of a geotextile manufactured by TenCate Geosynthetics
firmly holding two optical fibers with a total of eleven Bragg networks
measuring local strain, as well as another six Bragg networks on a
separate optical fiber to measure local temperature. The interrogator
was made by Scaime.
Dune displacement from July 2012 (grey) to April 2013 (color).
Dune speed vs size obtained from historical images of GoogleEarth.
November 2012 in Qatar
Another animation of the temperature experienced by the probe buried
from May 2011 to July 2012 is available by clicking on the image below. This solution of the heat equation was obtained with Comsol Multiphysics subject to a surface temperature boundary condition calculated using the pdepe toolbox in Matlab from data obtained with our weather station, see explanations in this article.
Top to bottom and left to right: Jin Xu operates the Leica TS02 theodolite
mapping the dune surface. Sara Abdul-Majid samples a dune for
microbiological analyses. Michel Louge is viewed through the Leica
reticle in the searing July heat.
Top to bottom and left to right: Michel Louge and Alexandre Valance interrogate the ThermoWorks RTR-53 humidity/temperature recorder buried in the dune. Alexandre Valance holds the Young rain gauge that he deployed high above his flux "saltation meter" to avoid sand contamination. Renee Richer sets up the LiCor 8100A for CO2 flux measurements on the dune surface. Anthony Hay sets up the AMS soil gas sampling cones for CO2 analysis. Alexandre Valance stands on the dune. A group picture.
Click on this link to animate the graphs below for the entire April 13-23 duration.
Top to bottom: data from April 13
to 23 for H2O mass
fraction at 15 depths.
A
serendipitous rainstorm occurred on April 13, 2012, causing massive
changes
in humidity near the surface, which took several days to dry up. Then a
smaller rain fell mid-day on April 22, causing further disruption to
the humidity time-history.
On November 21, 2011, Sara Abdul Majid's presentation on this
research at the Qatar Foundation's 2011 Annual Research Forum won the "Best Environment Research Program of the Year," which carries a $100,000 award encouraging us to pursue this work, see this article in the Qatar Tribune, and this one written by Susan Lang for the Cornell Chronicle. The New York Academy of Sciences also wrote a report on the conference, available by clicking on the tab "Meeting Report > Soil Science" of this web site.


See also the July 2011 Newsletter from Kipp & Zonen, and an article in French written by Celine Duguey for l'Espace des Sciences de Rennes.
Left: Sara Abdul-Majid and Michel Louge pose behind the weather station that they installed in November 2011. The station includes a Nomad2 Wind Data logger that acquires signals from a Young tipping bucket rain gauge, two SecondWind C3 anemometers, a SecondWind NRG 200P wind vane, and a Young combined HMP155 temperature/humidity sensor from Vaisala with radiation shield.The station is powered by a REC10-12 battery and a solar panel. Right: Michel Louge installs a fence in January 2012.

From right to left: Said Al-Hajri, one
of his camels, and Michel Louge pose for a photo in January 2012. Mr.
Al-Hajri supports our research by providing essential logistical
support near his farm.
Top, left to right: Anthony Hay, Renee Richer, Sara Abdul-Majid, Michel Louge. Bottom: system tested in the lab; Renee and Sara test the LiCor; Michel and Renee raise the weather station with Nexgen anemometer and wind vane acquired with a Second Wind NOMAD 2 data logger, as well as two ThermoWorks temperature and humidity USB gauges. Data from the capacitance instrument, the temperature probe, and the Kipp & Zonen net solar radiation detector was acquired with a National Instruments cRIO, which, together with a 20Ah LiPo battery from Tenergy, allowed us as long as 60 hours of autonomy. Matthew Blair wrote a tutorial on developing the LabView-based software for the cRIO.
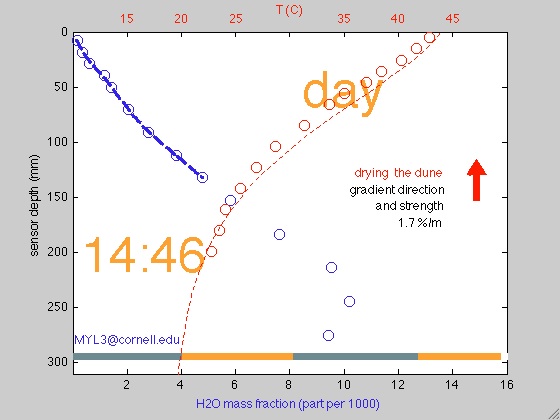
The movie below shows variations of diurnal sand temperature (red) and humidity (blue) below the surface at the toe of a barchan sand dune taken on March 19-21, 2011 in Qatar. The dashed red line is a numerical model of temperature time-history obtained by solving the unsteady heat equation in the sand bed with input from the measured Kipp & Zonen net radiation flux on the surface and the turbulent heat transfer flux at the surface arising from the measured wind speed. The vertical arrow indicates the direction and strength of humidity gradient at the surface. The blue line is a spline fit to the data that is used to evaluate the gradient. Note a gradual drying of the bed over the 44 hours of this field experiment.
Top, from left to right below the group photos: Michel Louge inserts his 15-sensor capacitance probe made of a PCB designed using PCB Artist through the surface of a barchan dune in the
Sahara desert near Akjoujt (19N 50.637' 014W 08.869') in January 2011; close-up of the PCB capacitance probe that records depth profiles of volumetric water content < 1% per mass accurately by multiplexing the sensors to single-channel capacitance processing electronics; close-up of the temperature probe made of 15 National Semiconductor
LM235 sensors deployed along the capacitance instrument. Middle: data acquisition system based on a National Instrument USB-6259 BNC acquisition board driven by an Acer Aspire ONE 532h-2588 laptop of low power consumption (< 1 amp at 14 V); the mutiplexing electronic box shown at the upper left was built by
Patrick Chasle at the Université de Rennes. Bottom, from left to right: two ThermoWorks
TW-USB-2-LCD+USB data loggers
recorded diurnal variations of ambient
temperature and relative humidity in the turbulent boundary layer above
the surface, along with two anemometers recording wind speed and
direction using a Nomad data logger; a Kipp & Zonen NR-Lite 2
recorded simultaneously irradiation from the sun minus radiosity from
the sand surface. Patrick Chasle shows the 100 W solar panel, which
allowed us, together with a 30 Ah Lithium Ferro Phosphate Ion
rechargeable battery donated by Dr. Chun-Chieh Chang, complete energy
self-sufficiency in the field.
Anthony Hay observes live microbes with fluorescence microscopy using a Paralens kit, and explains students at the Faculte des Sciences de Nouakchott the significance of the microbiology in sand dunes.
Movies below show variations of diurnal sand temperature and humidity below the surface at the toe of a barchan sand dune taken on January 19-21, 2011.
The graph below also provides wind speed at two elevations above ground, ambient temperature and humidity, and net radiation flux on the Mauritania barchan. Kipp & Zonen, manufacturer of the radiation instrument, published a short article on our work in its July Newsletter.
In March 2010, we carried out field experiments near Akjoujt, as well as in the Banc d'Arguin National Park
of Mauritania (19N 29' 31.6"; 016W 24' 50.9"). Left: Alexandre Valance records the location of the relative
humidity/temperature profile measurements. Center: Michel Louge
connects instruments before carrying out measurements. Right: Ahmed
Ould el Moctar and Michel Louge enjoy breakfast after a night of
measurements on a barchan sand dune.
Left: Dah Ould Ahmedou (Faculté des Sciences de Nouakchott) monitors the data acquisition system. Right: group photograph; from left to right: our tireless driver Mohameden Ould Eddi, Ahmed Ould el Moctar (Université de Nantes), Pascal Dupont (INSA de Rennes), Alexandre Valance (Université de Rennes 1), and Michel Louge.
Earlier publications
Louge, M. Y., A. Valance, A. Ould el-Moctar, and P. Dupont (2010), Packing variations on a ripple of nearly monodisperse dry sand, J. Geophys. Res., 115, F02001, doi:10.1029/2009JF001384.
This paper reports measurements of solid volume fraction at the
surface of sand ripples using our capacitance technique.
By recording variations of sand elevation at the capacitance probe (see
picture below), we find that sand ripples have compaction at troughs
near random jammed packing (~64%) and near the minimum packing for a
stable solid at crests (~54.5%). The paper discusses these results in
the light of models of aeolian transport. It also describes a seepage
flow of air that is driven by the Bernouilli effect as streamlines
contract and expand on ripples. A short movie demonstrates that
ripple crests cannot sustain much stress, as explained in the paper.
Measurements of the ripple profile with a diode laser and solid
volume fraction with a capacitance probe. From left to right, Michel
Louge, Alexandre Valance, Dah Ould Ahmedou, Ahmed Ould el Moctar, and
Ahmedou Ould Mahfoudh, February 2006.
Louge, M. Y., A. Valance, H. Mint Babah, J.-C. Moreau-Trouvé, A. Ould el-Moctar, P. Dupont, and D. Ould Ahmedou (2010), Seepage-induced penetration of water vapor and dust beneath ripples and dunes, J. Geophys. Res., 115, F02002, doi:10.1029/2009JF001385.
This paper reports measurements of solid volume fraction and humidity in sands just below the surface of a barchan dune in the Sahara using our the same probe we had deployed in snow packs. The paper also shows that the seepage flow through the sand surface acts forces dust particles to penetrate the ripple surface through troughs and guides water vapor through crests. The suction of dust into ripple troughs, which causes it to accumulate under a protective sand surface, may explain why desert air is so clear under normal winds, while dust only resuspends during unusually high winds.
A short erratum clarification can be downloaded here. It corrects a minor parenthetical point on Darcy shear stresses on p. 4, shortly after equation (10).
(a) Channeling of moisture through crests and (b) dust
penetration in troughs driven by seepage on sand
ripples;
for details, see Louge, et al (2009).
M. Y. Louge, A. Valance, A. Ould el-Moctar, D. Ould Ahmedou, and P. Dupont: "Model for surface packing and aeolian transport on sand ripples," Powders & Grains 2009, M. Nakagawa, ed. (2009).
This paper extends our analysis of the aeolian transport on sand ripples. It predicts the threshold shear velocity, and compares aeolian transport on Earth and Mars.A movie shows wind transport on a small barchan. A movie requiring longer download and only playing on QuickTime (.mov extension) shows various modes of avalanching on the downwind face of barchan dunes.
Alexandre Valance (right) and Michel Louge (left) record the volume fraction on sand ripples near the
route de l'Espoir in Nouakchott.
 The
snow probe deployed on a sand dune in Mauritania.
The
snow probe deployed on a sand dune in Mauritania.  Group
photo: from right to left: Valance, ould Ahmedou, ould el Moctar,
Louge.
Group
photo: from right to left: Valance, ould Ahmedou, ould el Moctar,
Louge. Water balance in barchan dunes
Current work involves the water balance in sand dunes of hyper-arid regions, see for example our simulations of water penetration through a mobile dune after modest desert rain:
Simulated water retention in a barchan sand dune 120 days after modest rain. This 3D simulation was carried out by programming Richards' equation on the Comsol Multiphysics platform.
Mobile dunes can harbor a remarkable amount of water after rain, despite hyper-arid desert conditions. Click on the picture for animation. This 2D simulation was carried out by programming Richards' equation on Comsol Multiphysics.
You can generate barchan dune profiles in the figure below using this Matlab program, which implements dune dimensions reported by G. Sauermann, P. Rognon, A. Poliakov, H. J. Herrmann, The shape of the barchan dunes of Southern Morocco, Geomorphology 36, 47-62 (2000).
You can do similar calculations with this Mathematica notebook.